Platform
Solutions
Resources
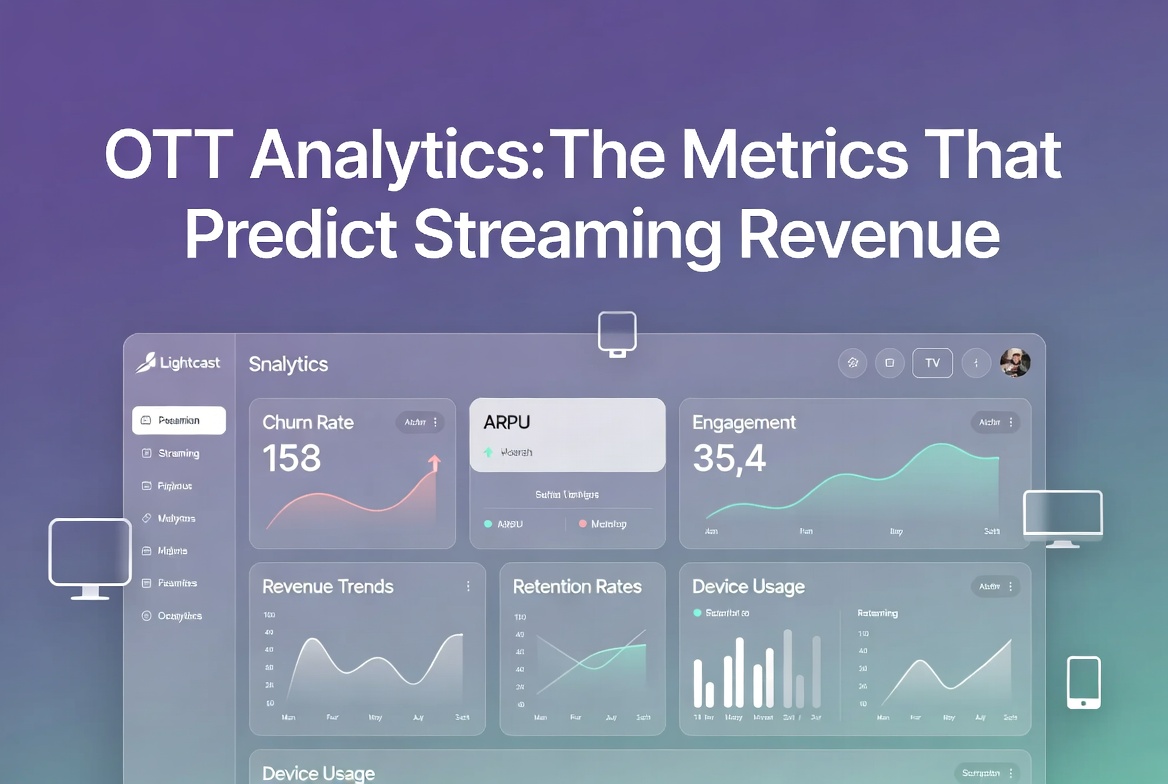
OTT analytics are the audience and performance metrics a streaming platform captures to explain what is happening to revenue and why. The handful that actually predict revenue are churn, average revenue per user, viewer engagement, content completion, and retention, not raw view counts. Lightcast delivers these across live and on-demand from a single platform, and gives content publishers full ownership of the underlying data, since Lightcast does not retain, monetize, or share it, across 5,000+ organizations. The metric that matters most in 2026 is churn, because in a saturated market you keep revenue by holding subscribers, not by chasing new ones.
Most streaming dashboards drown you in numbers that feel important and predict nothing. Total views is the classic vanity metric. The job of OTT analytics is to surface the few signals that tell you whether your business is getting healthier or quietly leaking money.
OTT analytics is the measurement layer of a streaming platform. It tracks how viewers find your content, how long they watch, what they finish, when they subscribe, and when they leave, then ties those behaviors to revenue. Good OTT analytics answers one question: which content and which decisions actually make money.
The distinction that matters is between activity metrics and revenue metrics. Views, sessions, and impressions describe activity. Churn, ARPU, and lifetime value describe the business. A post that gets a million views and converts no one is a cost, not an asset. For the full framework, see our pillar on video analytics and insights for content publishers.
Five metrics carry most of the signal, and each has a 2026 benchmark worth measuring against.
Churn rate. The percentage of subscribers who cancel in a period. Under 3 percent monthly is excellent, 3 to 5 percent is healthy, 5 to 8 percent needs work, and above 8 percent is a serious problem. Churn is the single strongest predictor of long-term revenue.
Average revenue per user (ARPU). Total revenue divided by active users. The number matters less than the direction. Stable or rising ARPU means your pricing and packaging are working.
Engagement. Healthy platforms see 35 to 60 minutes of watch time per session and 3 to 6 viewing sessions per week. Engagement is the leading indicator of churn, since people cancel what they stop watching before they cancel what they pay for.
Content completion. A 60 to 80 percent completion rate tells you the content delivers on its promise. Low completion on high-traffic titles is a content problem hiding inside a traffic win.
Retention. Returning monthly viewers of 70 to 85 percent and renewal rates of 80 to 90 percent are the health check on the whole model. For how these metrics should shape strategy, see our post on digital media strategy for content publishers.
Because the growth model flipped. For a decade, streaming grew by signing up first-time subscribers. That audience is now saturated, so the industry has openly shifted from rapid acquisition to retention as the priority. When you can no longer count on a wave of new subscribers, every cancellation is revenue you have to replace before you grow at all.
Churn is also the most actionable metric, because engagement predicts it. A subscriber whose watch time is falling is telling you they are about to leave, weeks before they cancel. OTT analytics that connect engagement to churn let you intervene while the subscriber is still yours. This is also where free trial conversion matters, since a healthy 25 to 45 percent trial-to-paid rate feeds the top of the funnel that retention then protects. Publishers monetizing through subscriptions should pair this with our guide on how to monetize OTT services.
Analytics are only as trustworthy as the data underneath them, and only as useful as your ability to act on the full picture. If your platform harvests, monetizes, or resells your audience data, you are making decisions on a partial view while someone else optimizes against the complete one. Your first-party signal is the asset that compounds, and it leaks the moment a vendor treats it as theirs.
Lightcast does not retain, monetize, or share client data. The publisher owns the entire audience relationship, so churn models, pricing tests, and content decisions are built on complete first-party data that gets sharper over time. Real-time analytics only help if you can also act on them, which is why measurement and control belong on one platform. See how that works in our post on real-time content control for streaming platforms.
A single CMS measures subscription, ad-supported, and pay-per-view, across live and VOD, so you see the whole audience in one place instead of reconciling three vendor dashboards.
Churn, ARPU, engagement, completion, and retention sit alongside views and sessions, so the numbers that predict revenue are the ones in front of you.
Lightcast does not retain, monetize, or share client data. Every signal stays yours, which is what makes churn prediction and pricing decisions get better over time rather than feeding a vendor's ad business.
Insights connect to action across Roku, Fire TV, Apple TV, iOS, Android, and web simultaneously, over 70,000+ global CDN nodes, so what you learn from the data you can change in the moment. Explore the platform on our media cloud OVP page.
OTT analytics is the measurement layer that separates activity from revenue. The metrics that predict the business are churn, ARPU, engagement, completion, and retention, and in a saturated 2026 market churn leads them all, because retention now beats acquisition. The quality of every one of those numbers depends on owning your first-party data. Lightcast delivers analytics across live and on-demand on one CMS with full data ownership, across 5,000+ organizations and 12,000+ branded apps, and was named Fastest Deployment OTT Platform Provider 2026 by The Silicon Review. To learn more or schedule a demonstration, visit lightcast.com.